


The odds are in El Niño’s favor right now.
This natural weather phenomenon, part of the El Niño-Southern Oscillation, or ENSO, occurs when warmer-than-average water extends throughout most of the equatorial Pacific Ocean just below the surface. That’s happening now. And powerful bursts of westerly wind have pushed immense amounts of warm water eastward, toward the Niño3.4 region where sea surface temperature, along with other atmospheric conditions, is used to assess the state of ENSO.
On May 14, in its monthly ENSO outlook, the NOAA/National Weather Service Climate Prediction Center gave an 82% chance that El Niño will be in place for the period May through July, which implies that it’ll be here within weeks.
How do experts know when El Niño has arrived?
El Niño conditions are declared when the atmosphere and ocean are in sync and the Niño3.4 sea surface temperature is at least 0.5 degrees Celsius (0.9°F) warmer than the seasonal average.
But just as hurricanes can and do stray from the “cone of uncertainty” at times, it’s vital to remember that El Niño can do much the same. Preparing for the prototypical outcomes is a smart move, as long as you keep in mind that forecasting the El Niño-Southern Oscillation is more a matter of probabilities than certainties.
NOAA now uses a Relative Oceanic Niño Index, or RONI, in which the Niño3.4 value is adjusted relative to the world’s tropical oceans as a whole; the goal is to keep global warming from smudging the signal of El Niño and La Niña events themselves.
Read: A new and better way to keep tabs on El Niño and La Niña
Nearly all seasonal forecast ensembles used to predict ENSO at agencies around the world now concur that the imminent event is likely to bring Niño3.4 warming of at least 1.5°C, which would push it into the “strong” category. And some of the ensemble averages are now going well above 2°C, even for the adjusted RONI index. That would put it in the ballpark of the biggest El Niño events in the NOAA database going back to 1950.
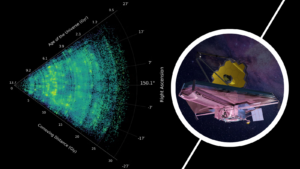
Individual ensemble members still cover a fairly broad range, with outcomes varying from a weak event to a record-stomping one, but as shown below, they’re about as close to being unanimous on a significant El Niño as you’re likely to see. (This output is mainly using the traditional pre-RONI index, which tends to run slightly hotter on recent El Niño events.)
What’s a ‘super El Niño’ – and will we get one?
Back in 2003, a group of researchers from Australia’s national science agency, CSIRO, invoked the term “super El Niño” in a Monthly Weather Review paper. They used it to describe events where the Niño3.4 departure from average was at least 3°C. The phrase has since been used more loosely around the world, especially in news articles and social media, but it’s not part of the toolbox of most professional ENSO forecasters.
“While ‘Super El Niño’ is sometimes used informally, it is not a scientific term,” said senior climatologist Felicity Gamble in a statement from Australia’s Bureau of Meteorology, which avoids the “super” moniker in its products.
The same is true of NOAA, which is going with “weak,” “moderate,” “strong,” and “very strong.” NOAA’s monthly ENSO outlooks now include month-by-month odds that a predicted El Niño event will fall into each of these four brackets. The odds of a “very strong” event peak at 37% in the November-to-January period.
Summing these categories, the odds that we will have El Niño at any strength are now greater than 90% from this summer through winter 2026-27, according to NOAA.

Jan Null of Golden Gate Weather Services, a California-based forensic meteorologist and former National Weather Service forecaster, began using “very strong” when the 2015-16 event arrived, so he’s happy to see NOAA doing the same. As Null puts it, “Everyone sees a forecast plume that looks like the liftoff of Artemis and goes crazy, and somehow early on attached the ‘super’ superlative to it.”
Does a stronger El Niño event lead to more extreme impacts?
Whether it’s super, very strong, mega, whiz-bang, or something else, the approaching El Niño could certainly land in the uppermost tier of what we’ve seen in recent decades. So does that mean the impacts would be correspondingly intense?
Alas, it’s not that simple.
“A strong El Niño event doesn’t always mean stronger impacts on our weather,” the Australian climatologist Felicia Gamble said in a statement released by that nation’s Bureau of Meteorology. “Sometimes a weak El Niño can lead to significant impacts on Australia’s rainfall and temperature, while a stronger event may have less noticeable impacts.”
ENSO expert Nathaniel Johnson, a meteorologist at NOAA Geophysical Fluid Dynamics Laboratory, noted in an email that a stronger El Niño event does raise the odds of the most prototypical outcomes. However, it’s not the only thing involved.
“In any given season and region, there are many large-scale patterns that help to shape our local weather,” said Johnson. “El Niño is just one of those factors, but it happens to be the most predictable on timescales of months to seasons. If the El Niño event is very strong, then it is more likely that the El Niño influence will dominate over those other, less seasonally predictable factors.”
That said, there are places where a strong El Niño event can lead to distinctly different outcomes than a weak or moderate one. In the eastern tropical Pacific, for example, surface waters – normally chilled by upwelling – are often too cool to support showers and thunderstorms even in moderately strong El Niño conditions. Beyond a certain threshold of strength, though, the normally dry eastern tropical Pacific will warm up enough to support heavy rainfall, Johnson said: “This would essentially indicate a shift of the entire tropical Pacific warm pool to the eastern Pacific, which would immediately impact regions like coastal Ecuador and Peru.”
The very name El Niño, which means the Christ child in Spanish, came from Peruvian fishers who noticed that their anchovy catches – typically some of the world’s largest – took severe hits from unusually warm water during certain years around Christmas. (Earlier this year, Peru’s anchovy fisheries called for a proactive early start to get ahead of the possible El Niño.)
The Galápagos archipelago and its distinctive food chain are also highly vulnerable to the heavy rains and warm waters of a strong El Niño event.
What might we expect with this El Niño event, and where?
El Niño’s impacts occur as the global atmospheric circulation is rearranged by the massive zone of rising, warm air (often as large as the United States) that develops over the eastern tropical Pacific. These impacts can be remarkably far-flung, but they’re typically strongest across the tropics – from the Indian and Pacific Oceans to the Atlantic and into Africa – and over the midlatitudes of North and South America, the land masses closest to the Niño3.4 region.
Read: Five things you need to know about El Niño’s likely comeback
In a nutshell, El Niño tends to bring dry (and often hot) conditions in and around Southeast Asia, parts of Africa, and the Amazon and Central America, while relatively cool and wet conditions often prevail over East Africa and the southern tier of the United States. The timing of these common repercussions (called teleconnections) varies a bit. For example, North American impacts are triggered largely by interactions with the midlatitude jet stream, so they’re normally strongest toward winter, when the jet stream is more active. On a global scale, the heat transferred from ocean to atmosphere during El Niño tends to cause record-warm years in our human-warmed climate.

In some parts of the world, the El Niño playbook is higher-confidence than elsewhere. One of those is the northern tier of the United States and much of adjacent Canada, where El Niño reliably delivers warmer-than-average winter weather. Emily Becker and Michael Tippett analyzed this connection as part of their deep dive into North American temperature responses to ENSO in a 2024 paper published in the Journal of Climate. This region sits hundreds of miles poleward from the broader-scale warming and drying that afflicts much of the tropics, but it’s part of the same web of El Niño teleconnections.
El Niño’s blunting of the usual big swings in winter temperatures across this region is noteworthy. “Not only does this warm zone experience many mild days during El Niño, but it also gets fewer cold snaps,” said Tippett (Columbia University). And while La Niña winters in the northern U.S. and Canada can be either warmer or colder than average, El Niño is more consistently on the warm side, Becker and Tippett found.
Sometimes, even a fairly dependable seasonal-scale tendency driven by El Niño can hide important smaller-scale details. The Indian monsoon tends to be drier than average during El Niño, but a 2025 analysis in Science found that amid these drier-than-usual monsoons, the occasional rainfalls that do occur seem to be turbocharged, dropping more extreme short-term rains than usual.
Likewise, hurricane activity tends to decrease in the Atlantic and ramp up in the Pacific during El Niño events. This may well pan out in 2026, based on sea surface temperatures and other ocean and atmosphere signals already showing up in seasonal models. But even in an otherwise quiet year, there could be periods of atmospheric alignment when dangerous Atlantic hurricanes still emerge.
One bright spot with El Niño is that it tends to suppress U.S. tornado activity during the winter and subsequent spring (see Figure 3 below). La Niña events sometimes but not always lead to major spring tornado outbreaks, whereas the suppressive effect of El Niño appears to be a bit more reliable. The big exception is in and around Florida: Some of the state’s worst tornado outbreaks on record outside of tropical cyclones occurred near the tail end of the powerful El Niño events of 1982-83 (on March 16-17), 1997-98 (on February 22-23), and 2015-16 (on February 23-24).

And what about climate change?
Very strong El Niño events are rare enough birds on their own, so it’s tough to assess how these events, and their impacts, will evolve as human-caused warming continues to grow.
Not that long ago, the 2023-24 El Niño event was expected to cause major global repercussions. And indeed, on the “traditional” Oceanic Niño Index, or ONI, it ended up in the “very strong” range, peaking at 2.1. However, the impacts didn’t play out as expected, especially in midlatitudes, where the connections to El Niño were unusually weak. As it happens, record heat was swaddling much of the world at the time, including tropical oceans, and that appears to have blunted the effects of El Niño.
In a 2025 Journal of Climate paper, a team led by Clara Deser, a senior scientist at the National Science Foundation National Center for Atmospheric Research, carried out a set of model experiments showing that long-term warming in the Indian and Atlantic tropical oceans, together with long-term cooling in the eastern tropical Pacific, can lead to a counteracting large-scale circulation that almost completely negates the effects of an El Niño event.
As Deser and colleagues wrote, “historical precedent may no longer be a reliable guide to ENSO teleconnections as anthropogenic warming patterns intensify.”
In a recent New York Times roundup of potential El Niño impacts, Deser said: “We are now in a different baseline climate.”
In a similar vein, Australia’s Felicity Gamble said: “The increasing warmth in our oceans, both globally and in the Australian region, mean that history is now a poorer guide for seasonal prediction.”
The 2023-24 event helped turn attention toward using the Relative Oceanic Niño Index, with the idea that RONI might work better than ONI in factoring out periods of intense tropics-wide heat (such as 2022-23) from the assessment of El Niño. Sure enough, the 2023-24 event reached the strong range in RONI, topping out at 1.5 (borderline strong) rather than landing in the more rarefied very-strong range on the traditional scale.
“The weakened impacts of the 2023–24 El Niño compared to expectations can be reconciled, at least in large part, by its substantially weaker amplitude based on RONI instead of the traditional ONI,” said NOAA’s Johnson.
If there’s a poster child for counterintuitive El Niño behavior, it’s the bizarre dryness that plagued Southern California during the winter of 2015-16, one of the strongest El Niño events on record. El Niño is often wet across much of California, but there’s ample variability, as documented by Jan Null. In a website post, Null described the 2015-16 case as the “poster child for ‘All El Niños are not the same!’ ”
Michelle L’Heureux, a physical scientist who leads the ENSO team at the NOAA/NWS Climate Prediction Center, encourages thinking of El Niño as shifting the odds of various seasonal outcomes (e.g., wetter, drier, hotter, cooler). If those odds are expressed as a bell curve, then the stronger the event, the further El Niño pushes that curve to one side.
L’Heureux points to the 2015-16 California case as a cautionary tale on how El Niño forecasts should be treated as guidance rather than a guarantee.
“This doesn’t mean a major El Niño didn’t happen or it did not have a considerable influence on the global circulation (it did). It means that, in southern California, even a very strong El Niño was not able to nudge the distribution over enough to the point where drier outcomes were impossible.”
Looking ahead, L’Heureux added: “In 2026-27, I am confident we will see at least some locations in the U.S. that will not align with the expected El Niño impact.”
Jeff Masters contributed to this post.
![]()