

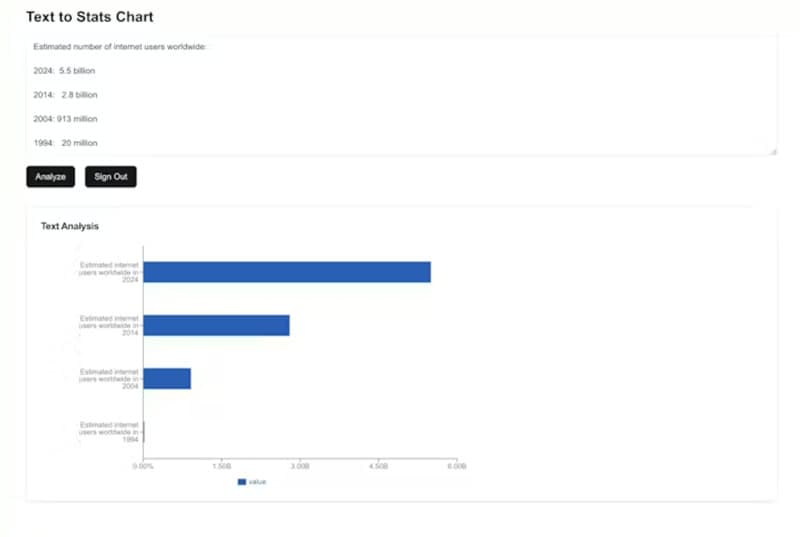
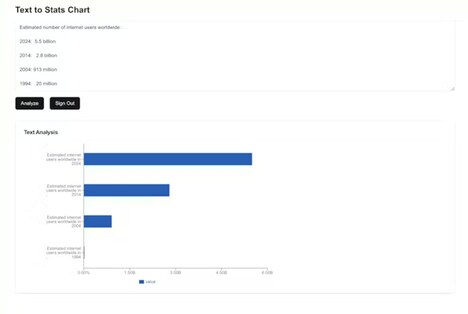
Text to Visual Stat is an AI-powered tool designed to convert textual data into interactive and visually compelling statistical representations. The platform enables users to take raw data in text form — such as reports, survey results, or numerical summaries — and generate charts, graphs, or other visual formats that enhance comprehension and engagement.
This functionality can benefit professionals in business analytics, educators presenting complex concepts, and researchers needing quick visualizations of data patterns. By automating the conversion from text to visual statistics, the tool reduces manual effort and the need for advanced design or data visualization expertise. Text to Visual Stat demonstrates how AI can simplify data interpretation, making it accessible, interactive, and immediately actionable, while helping teams and individuals communicate insights more effectively.
Image Credit: Text to Visual