


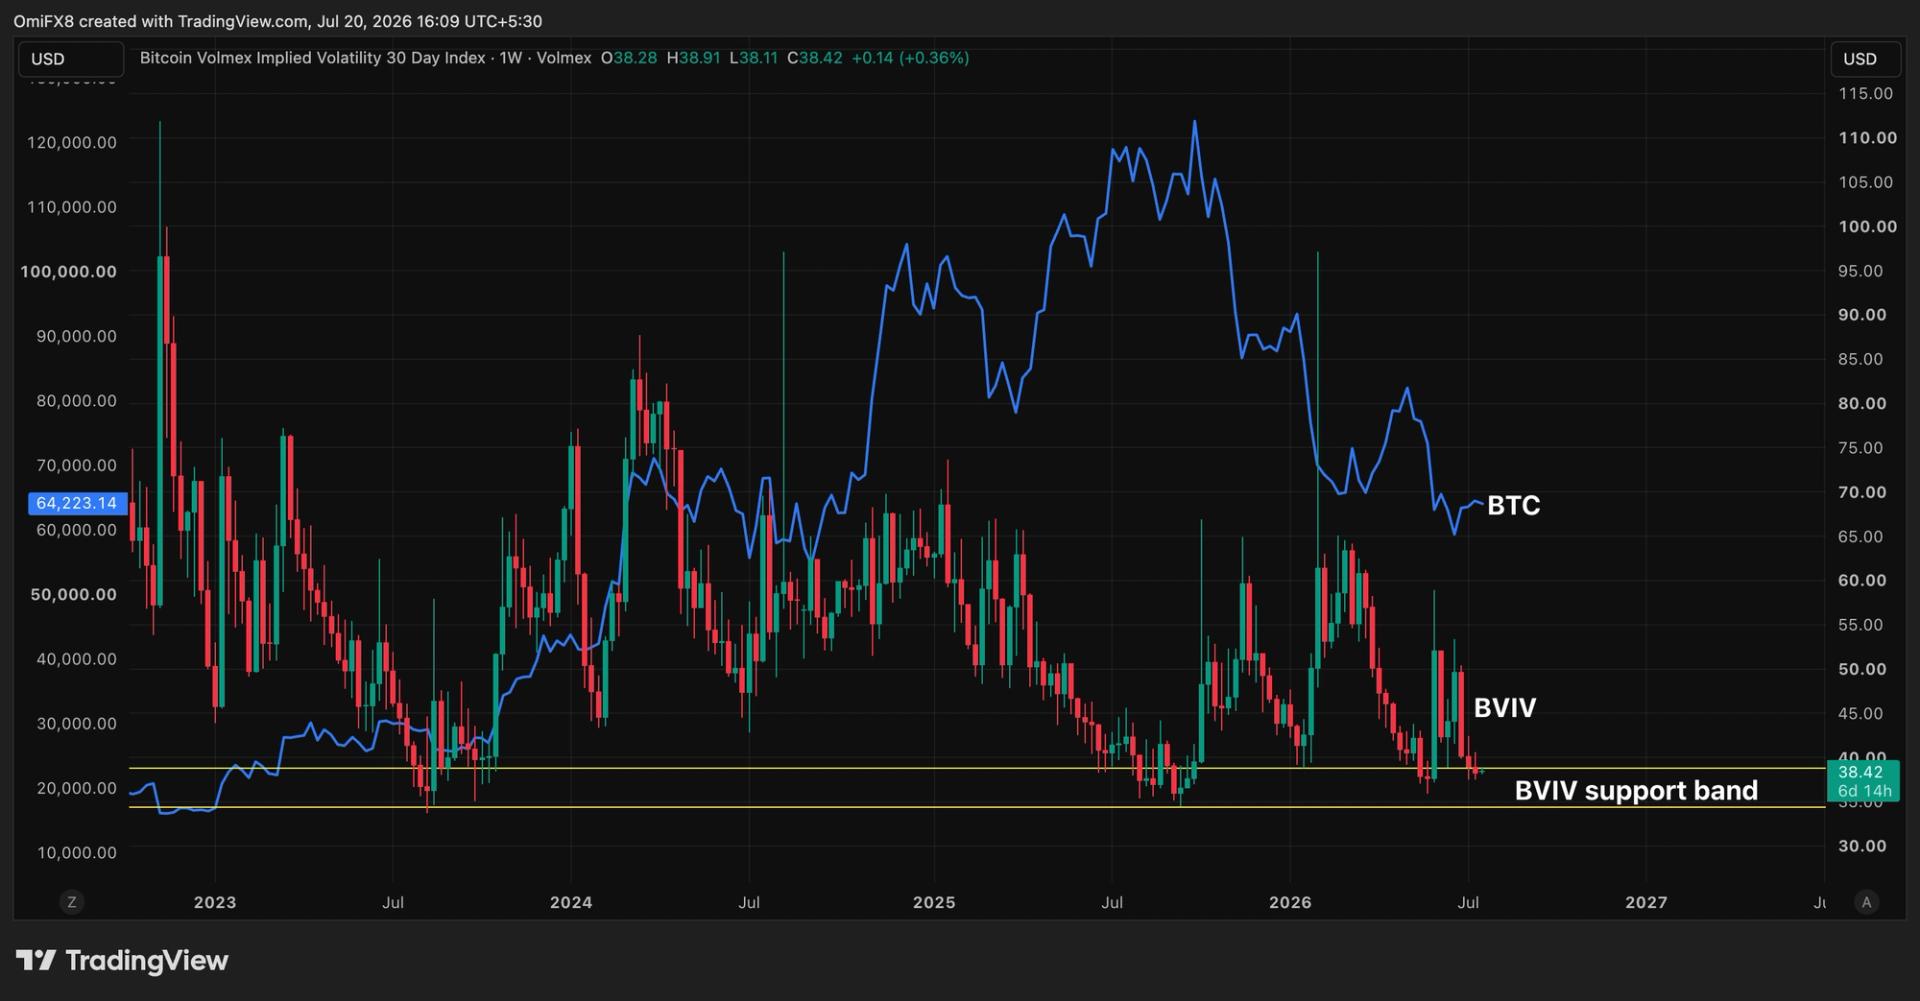
While past patterns are never a guarantee of future performance, volatility metrics are widely known to be mean-reverting. This cyclical nature suggests that periods of below-average volatility are often followed by higher turbulence, while above-average volatility paves the way for market stability.
Currently, the index is trading below both its 30-day and 200-day simple moving averages. In essence, volatility is relatively “cheap” and sitting at a historically reliable support zone, suggesting the measure could be set to rise, which means another round of turbulence.
For now, bitcoin continues to trade just above $64,000, maintaining the range-bound price action that has persisted since last Wednesday. While some analysts have noted two consecutive weeks of spot ETF inflows, the capital movement is tiny compared with the billions yanked from the market during the preceding eight-week outflow streak.
Global volatility gauges in traditional markets are currently offering mixed signals. South Korea’s KOSPI VIX is currently above 70%, its highest level since the 1990s. Meanwhile, Wall Street’s VIX jumped over 12% to reach 18% on Friday, where it continues to hover. However, these levels have been in the play for months, which means that stocks are anything but panicked.
Additionally, the MOVE index, the 30-day volatility gauge for U.S. Treasury notes that underpins global finance, remains steady around 70%, as it has since April, offering a constructive cue for risk assets. Stay alert!


