


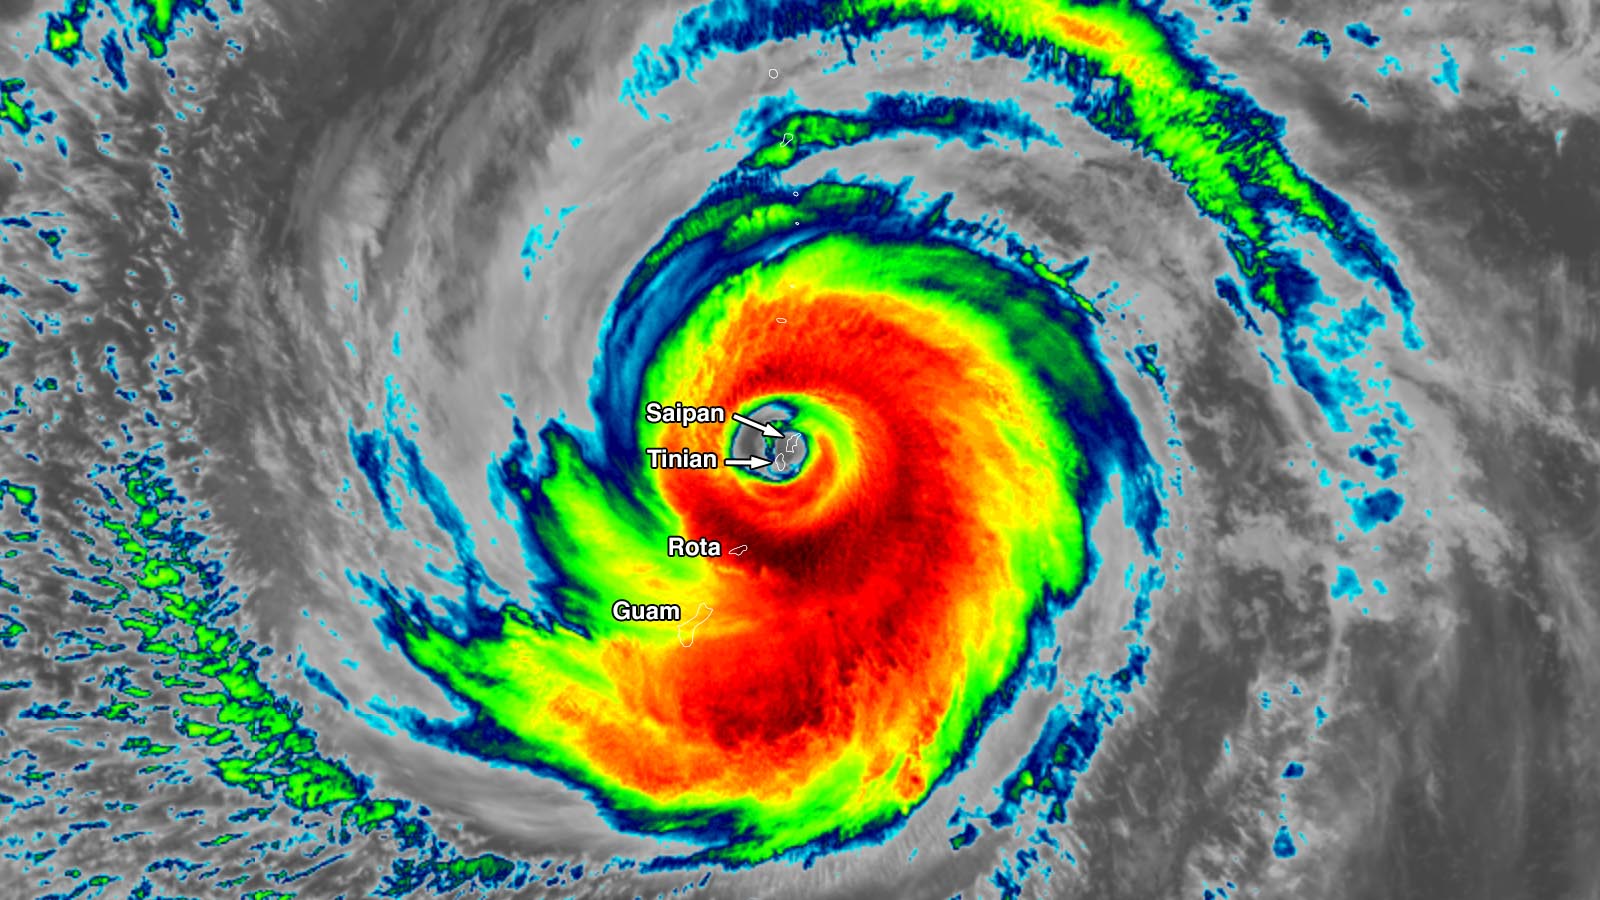
Typhoon Sinlaku made landfall over the U.S. Northern Mariana Islands at approximately 10:30 a.m. EDT April 14, with the large eye of the storm passing over both Tinian and Saipan islands simultaneously. According to the Joint Typhoon Warning Center (JTWC), Sinlaku had sustained winds of 145 mph (230 km/hr) at 8 a.m. EDT, April 14, shortly before landfall. The Japan Meteorological Agency, the official agency responsible for typhoon warnings in the Northwest Pacific, estimated that Sinlaku’s central pressure was 920 mb at that time.
Fortunately, an eyewall replacement cycle that began on Monday significantly weakened Sinlaku over the prior 24 hours: The typhoon weakened from a Cat 5 with 175 mph (280 km/hr) winds at 8 a.m. EDT Monday to a Cat 4 with 145 mph (230 km/hr) winds at 8 a.m. EDT Tuesday. Since damage increases exponentially with wind speed, this weakening theoretically reduced Sinlaku’s potential damage by over a factor of four, according to a damage table from NOAA. Nevertheless, damage from Sinlaku will be severe on both islands.
The U.S. Northern Mariana Islands is a U.S. commonwealth, separate from the U.S. territory of Guam. Close to two-thirds of residents of the Northern Marianas are U.S. citizens. According to the 2020 census, the populations of the three main islands were:
Saipan: 43,385
Tinian: 2,044
Rota: 1,893
The highest winds reported from Sinlaku thus far on Saipan have been 84 mph (135 km/hr), gusting to 130 mph (209 km/hr), at 9:54-9:55 p.m. local time. Although Guam and Rota are on the storm’s weaker left-hand (south) side, they have been experiencing high winds and heavy rain squalls, especially on Rota. The highest wind gusts on Guam thus far have been 73 mph (118 km/hr). Saipan recorded 5.32 inches (135 mm) of rain on Monday.
The National Weather Service in Guam is forecasting total rainfall amounts of 15-25 inches over Tinian and Saipan, seas of 20-30 feet, and storm surge flooding of 5-8 feet. Sinlaku is forecast to gradually weaken and recurve to the north and northeast during the remainder of the week, and is not a threat to any other land areas.

An unprecedented battering by Cat 4s and Cat 5s for the U.S.
Beginning in 2017, the U.S. has gotten absolutely hammered by high-intensity Category 4 and 5 hurricanes: Seven have hit the continental U.S., one has hit Puerto Rico, and now two have hit the Northern Mariana Islands. That’s as many U.S. Cat 4 and Cat 5 landfalls as had occurred in the prior 57 years (Fig. 1). I did an in-depth analysis of why this might be happening — it’s a combination of natural variability and climate change — in a previous post this year, “Will climate change bring more major hurricane landfalls to the U.S.?“

Sinlaku: a near-repeat of the track of Cat 5 Super Typhoon Yutu of 2018
Earth’s strongest storm of 2018, Super Typhoon Yutu, followed a nearly identical track as Sinlaku, hitting Tinian Island in the U.S. Northern Mariana Islands on Oct. 24 with sustained winds of 180 mph (290 km/hr). The strong northern eyewall of Yutu affected Saipan Island. Winds this strong at landfall are rarely observed, and Yutu is tied for eighth place for the strongest tropical cyclone at landfall in world history, according to data from the National Hurricane Center (NHC) and Joint Typhoon Warning Center (JTWC). The only stronger landfall in the U.S. or its territories was the 1935 Labor Day hurricane in the Florida Keys, with 185-mph winds. According to the Japan Meteorological Agency, Yutu’s central pressure at landfall was 900 mb, which ties it with Hurricane Camille of 1969 as the second-lowest landfalling pressure for a tropical cyclone hitting the U.S. Only the 1935 Labor Day hurricane in the Florida Keys had a lower pressure at landfall — 892 mb.
Below are the top 13 strongest tropical cyclones at landfall globally since 1945, based on hurricane records from the National Hurricane Center (NHC) and typhoon records from JTWC. (Ominously, 10 of the 13 strongest landfalls in recorded history have occurred since 2006.)
1) 195 mph: Super Typhoon Goni, 2020, Catanduanes, Philippines;
2) 190 mph: Super Typhoon Haiyan, 2013, Leyte, Philippines;
2) 190 mph: Super Typhoon Meranti, 2016, Itbayat, Philippines;
4) 185 mph: Hurricane Melissa, 2025, Jamaica;
4) 185 mph: Hurricane Dorian, 2019, Islands of the Bahamas;
4) 185 mph: Great Labor Day Hurricane, 1935, Florida, U.S.;
4) 185 mph: Super Typhoon Joan, 1959, Eastern Taiwan;
8) 180 mph: Super Typhoon Yutu, 2018, Tinian, Northern Marianas;
8) 180 mph: Hurricane Irma, 2017, Leeward Islands;
8) 180 mph: Cyclone Winston, 2016, Fiji;
8) 180 mph: Super Typhoon Megi, 2010, Luzon, Philippines;
8) 180 mph: Super Typhoon Zeb, 1998, Luzon, Philippines; and
8) 180 mph: Cyclone Monica, 2006, Northern Territory, Australia.
Yutu killed two people on Saipan Island, injured more than 120, and left more than a quarter of the island’s 45,000+ residents homeless. Most of the structures on Tinian Island were destroyed or damaged, and FEMA-estimated damages in the Northern Mariana Islands were just over $1 billion (2026 USD). Yutu went on to hit the Philippines as a Category 2 storm on Oct. 30, killing 12 and causing $380 million (2026 USD) in damage.
The only other Pacific Cat 5 to make a direct landfall in the U.S. was Super Typhoon Karen on Nov. 11, 1962. Karen hit Guam with 170 mph (195 km/hr) winds. According to EM-DAT, the international disaster database, Karen killed six and did $2.7 billion in damage (2026 dollars). The only other U.S. billion-dollar typhoon in the Pacific was Guam’s most recent one, Typhoon Mawar, which passed about 10 miles north of Guam on May 24, 2023, as a Cat 4 with 145 mph winds. Mawar battered the island for 15 hours, killing two and causing damages of $4.5 billion (2026 USD).
El Niño supercharges typhoon seasons
Sinlaku is the classic type of early-season super typhoon that one would expect to see when the ocean/atmosphere system is on its way toward a strong El Niño event, as currently appears to be the case (see our post last week, A powerhouse El Niño event appears to be brewing for 2026-27). Typhoons tend to form farther east, away from Asia, during an El Niño episode, because of the warmer waters present over the Central Pacific. Thus, El Niño-year typhoons take longer tracks over water before recurving or hitting Asia, resulting in a greater chance of reaching Category 5 intensity.
Over the 79 years of Joint Typhoon Warning Center monitoring, there have been 317 super typhoons — defined as having maximum sustained 1-minute average winds of at least 150 mph (240 km/hr) — an average frequency of around four per year. Most of these reach the Cat 5 threshold (winds of at least 156 mph). The strong El Niño year of 1997 saw a record number of Category 5 super typhoons in the Northwest Pacific — ten, along with a record accumulated cyclone energy (ACE) index of 594. The first Cat 5 of 1997, Super Typhoon Isa, arrived very early, on April 20. And at one point — on October 17, 1997 — two incredibly strong Cat 5 super typhoons existed simultaneously: Super Typhoon Joan (185 mph winds) and Super Typhoon Ivan (180 mph winds). This is the only time on record that two Category 5 storms of such extreme intensity have existed simultaneously (Fig. 3).

Tropical cyclone frequency has been decreasing in the Northwest Pacific since 1990
Though we’ve been seeing a global trend toward the strongest tropical cyclones getting stronger in recent years — because of climate change — climate change is also likely the culprit behind a recent decline in the total global frequency of tropical cyclones. A decreasing trend is particularly evident in the Northwest Pacific (Fig. 4); this decrease is thought to be primarily from the more La Niña-like climate that has been observed since 1990. A La Niña-like climate favors tropical cyclone formation zones closer to Asia, resulting in less time spent over water and less time to organize into a tropical cyclone.

Bob Henson contributed to this post.
![]()